Zerosyntax
Data and analytics

Data and analytics that turn information into clearer business decisions

We help companies organise data, build clearer reports and create an analytics foundation that brings more clarity to everyday and strategic decisions.

Clearer data, stronger insights and analytics planned around real business priorities.

From scattered data to a clearer view of the business
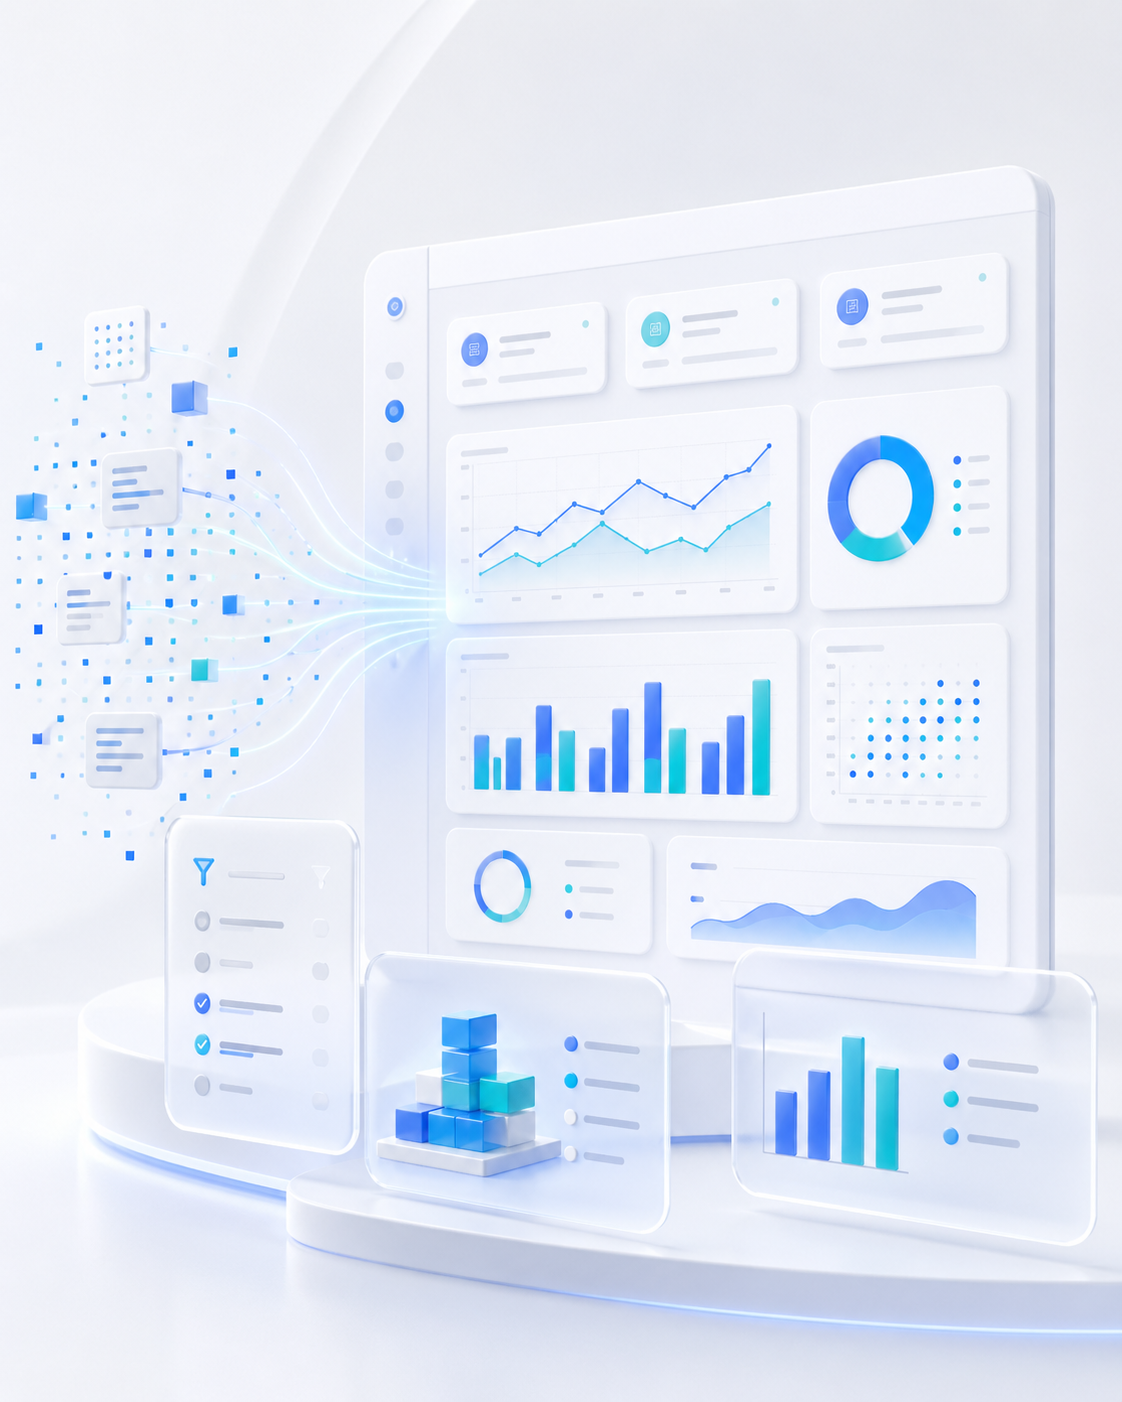
Data and analytics visual for modern business decision-making
Clearer data Important information becomes easier to view and understand.
Better insights Reports and analytics help teams see what is really happening.
Smarter decisions Data gains more business value when it is organised and available at the right moment.
Why data and analytics

When data exists but does not provide enough clarity for quality decisions

Many companies have enough data, but it is scattered, difficult to review or hard to connect with real business questions. Reports may exist, but clear insights are missing.

Data and analytics bring more order to how a company views performance, processes and trends. Instead of relying on assumptions, you gain a clearer foundation for planning and decision-making.

Without the right approach
  • Data scattered across multiple tools and sources
  • Reports without enough clarity and context
  • Decisions are slower and more assumption-based
With the right solution
  • A clearer view of key data and trends
  • Reports that help teams act faster
  • An analytics foundation ready for growth and better planning
Capabilities

What we can improve through data and analytics

Key focus

We build an analytics foundation that turns data into a clearer view, better insights and smarter decisions.

Whether the priority is improving reporting, connecting data sources or creating dashboards for teams and management, the goal is the same: more clarity and greater business value from data.

Clearer visibility Data becomes more organised and easier to understand.
Better insights Teams and management get more relevant information for action.
Ready for growth The analytics model stays ready for higher data volume and more complex needs.
We create dashboards and views that help teams and management quickly see status, trends and key metrics.
We help reports and key indicators become more clearly defined, more useful and more closely connected to real business goals.
We connect data from multiple systems and tools so reporting gives a more complete and reliable view of the business.
We help teams identify patterns, trends and changes that matter for planning and decision-making.
We create reports that match the real needs of operations, management and strategic business review.
We help data become more consistent, easier to review and better prepared for analytical use without unnecessary disorder.
When reporting exists but does not provide enough clarity, we make targeted improvements without unnecessarily replacing the existing system.
Key value

The greatest value is a clearer understanding of the business

Data has the greatest value when it helps the team see what is happening, why it is happening and where to respond before a problem grows.

Less uncertainty Important information becomes easier to review and interpret.
Faster decisions Teams and management can act faster when they have relevant insights at the right moment.
More business confidence Clearer data reduces reliance on assumptions and improvisation.
Clearer insights

The best analytics helps people see the bigger picture without getting lost in the data.

The focus is on reporting and views that provide enough clarity for action, not simply more tables and more numbers.

Data More organised and accessible
Insights Clearer and more useful
Teams Aligned around facts faster
Decisions More confident and faster
Work process

How we take data and analytics from disorder to a clear view

Each phase has a clear goal: more visibility, better insights and a more reliable basis for decisions.

01

Analysis

We review data sources, existing reports and the key questions the business needs clearer answers to.

02

Structure

We define KPIs, the reporting model and analytics logic so data serves real business goals.

03

Implementation

We connect sources, organise data and build dashboards and reports through controlled steps and checks.

04

Improvement

After implementation, we monitor the usefulness of reports, adjust the model and expand analytics around new needs.

Where it helps

Where analytics creates the most value

The greatest impact comes when data exists, but decisions and reporting are not yet clear or fast enough.

Business visibility

When management needs a clearer picture

When key data is scattered across several sources, it becomes difficult to quickly understand what is really happening in the business.

  • One place for key indicators
  • Faster view of results and variances
  • A clearer basis for decision-making
Optimisation

When you need to find where losses are happening

Analytics makes it easier to spot bottlenecks, weaker results and trends that need a timely response.

  • Earlier discovery of problems
  • Better understanding of process performance
  • Smarter planning for next steps
Technology foundation

We choose technology around the data and the goals

For analytics, it is important that tools support accurate data, clear views and a sustainable reporting model.

Visualisation

Tools for viewing and understanding data

Grafana React JavaScript TypeScript
Data processing

Logic that prepares and connects sources

Python Node.js Kafka Java .NET
Storage

Databases and platforms for reliable analytics models

PostgreSQL MySQL SQL Server MongoDB
Cloud and integrations

An environment for connecting and securely accessing data

AWS Azure Google Cloud Docker
Results and impact

Value becomes clear through better decisions

Good analytics shortens the path to answers, strengthens business visibility and helps teams act with more confidence and speed.

01

Faster decision-making

Key indicators become available without long manual data collection and checking.

02

A clearer view of results

Teams can more easily see trends, variances and priorities that need a response.

03

Less manual reporting

A more automated model reduces wasted time and improves reporting consistency.

04

A better foundation for growth

When data is structured, it is easier to expand analytics and plan the next business steps.

FAQ

Frequently asked questions about data and analytics

Short answers to the questions that most often come up before introducing dashboards, KPI models and reporting.

Need an assessment?

We can assess which data is worth connecting first and where analytics can create value fastest.

Yes. The problem is often not simply a lack of reports, but that they are not clear, connected or fast enough for everyday decision-making.
Yes. Analytics is often built on the existing systems, databases, spreadsheets and tools the company already uses.
That is common. The first step is to clean, connect and structure the data so reporting has a reliable foundation.
It depends on the number of sources, data quality and goals, but the first useful dashboards and reports can be delivered gradually.
We define KPIs around business goals, team responsibilities and the decisions that need to be made from the data.
Next step

If you want clearer reports and more confident decisions, let’s talk

We can review your data sources, goals and KPI priorities, then suggest the best next step.

Contact us

The first conversation focuses on data, reporting and business goals.